Finance for Non-Financial Managers: An Introduction to the Balance Sheet

A short guide to the Balance Sheet for Non-Financial Managers…

The Balance Sheet

The Balance Sheet lists a company’s assets and liabilities. It is prepared at a single point in time – and is valid for only that specific date.

It gives a ‘snapshot’ of a business’ financial situation, and reveals where the company’s financing came from – and how those funds were used to buy the company’s assets.

This funding is also referred to as ‘Capital Employed’. Capital Employed comes from three places – profits, loans and shares.

More formally, these sources of finance are known as ‘liability accounts’, organised in terms of equity and loans. This means that on an overall level, Capital Employed equals Equity plus Loans.

The Balance Sheet

As far as the Balance Sheet is concerned, money coming into the business is spent on a combination of Fixed Assets and Current Assets.

A Balance Sheet must always be ‘balanced’. This means that on the date it was put together, the business’ total assets must equal its total liabilities.
On a traditional Balance Sheet, assets and liabilities are kept totally separate from each other.

The Balance Sheet


The ‘working capital’ approach to formatting the Balance Sheet offsets current liabilities against current assets, in order to separately identify working capital.

The Balance Sheet

For many businesses, it helps to separate-out how the business is operated, from how it is financed. So the third way to approach laying-out the Balance Sheet is to use the ‘financial analysis’ format.

This approach clusters all account items relating to company finance on the capital side of the Balance Sheet.

From a financial perspective, a company’s performance is assessed both before and after financing. A number of ratios are used in both situations. Using the financial analysis format for the Balance Sheet makes them easier to calculate.

The Balance Sheet

The figure on the Balance Sheet for Retained Profit is calculated by taking the Retained Profit figure from the P&L and adding it to profits retained from previous financial periods.

This then allows us to calculate the following: Retained Profit from P&L + Retained Profits from previous years + Share capital = Owners’ equity/Shareholders’ funds.

About Brightbolts…

Brightbolts supports business by raising the financial literacy and business acumen of managers.

Brightbolts are specialists in helping managers and organisations raise their levels of financial literacy and commercial awareness. Our suite of customisable Finance for Non-Financial Managers eLearning courses are used by leading global organisations to equip their managers with the skills, understanding and acumen needed to be financially fit and ready for the challenges of running successful businesses.

Or contact us, to see how we can help you and your organisation…

[share title=”Share this Post” facebook=”true” twitter=”true” google_plus=”true” linkedin=”true” style=”color:#000″]

Finance for Non-Financial Managers: An Introduction to the Profit and Loss Account (P&L)

Profit and Loss AccountA short guide to the Profit and Loss Account (P&L) for Non-Financial Managers…

The P&L (also known as the Income Statement) is a Financial Statement that records the level of profit – or loss – that a business earns over a defined period of time (usually one year).

It does this by relating the income (also known as ‘sales’ or ‘revenues’) the business has earned to the costs and expenses the business has incurred.
The P&L starts by recording the income a company has generated through its sales over a given period. It then deducts a series of costs and expenses from this total to determine several different profit measures.

Profit and Loss Account Break Down

Cost of Sales is deducted from Sales to produce Gross Profit. ‘Cost of Sales’ are those outgoings which are most closely linked with providing services to clients, buying goods for re-sale, or manufacturing products.

Expenses are deducted from Gross Profit to produce Operating Profit or EBIT (Earnings Before Interest and Tax). ‘Expenses’ are incurred in the course of running the business on a day-to-day basis (e.g. advertising costs). They are not directly linked to sales.

Tax on profits and interest on borrowings are deducted from Operating Profit to produce Net Profit After Tax (or NPAT).

Dividends owed to the business’ shareholders are taken away from NPAT, resulting in Retained Profit.

Retained Profit is the proportion of sales/income that the company keeps, and can then use to drive further growth and investment. In this way, it is the ‘wealth’ the company has produced.

Sales may be made – and inputs may be supplied – on credit. This means that cash transactions for both sales and costs may not happen during the financial period.

So measuring profits requires accountants to analyse a company’s operating performance over a given period, by calculating costs incurred and sales made. This must be done accurately, despite the fact that associated cash flows may occur in different time periods.

Profit and Loss Account - Costs

Costs can only be entered onto the P&L if they relate to business activities that occurred during the period in question.

Materials are only counted if they were ‘consumed’ (otherwise they are counted as ‘stock’ – which is an asset, not a cost).

Profit and Loss Account Materials Costs


Services and overheads (e.g. power) are counted when bought (irrespective of cash flows).

Companies will pay interest on short-term bank loans and long-term financing from a variety of sources. Businesses will also receive interest payments on any investments they hold, plus their bank accounts.

The amount of tax owed on a business’ profits is calculated after interest has been deducted. Actual tax paid may be deferred into the future – but what is called a ‘provision’ is made in the P&L at this point to cover that payment, and counted as a deduction.

The level of dividends paid is decided by the business’ Directors. They will consider both the company’s projected cash needs, and what shareholders expect.

Profit & Loss Account –  Costs

A business works out how much material it has actually used over the course of a given financial period with the following equation:

Opening stock + Purchases – Closing stock = Materials used.

Usually, materials are valued on the basis of ‘historical cost’ (e.g. what the company paid for them at time of purchase).

Profit and Loss Account - Labour Costs
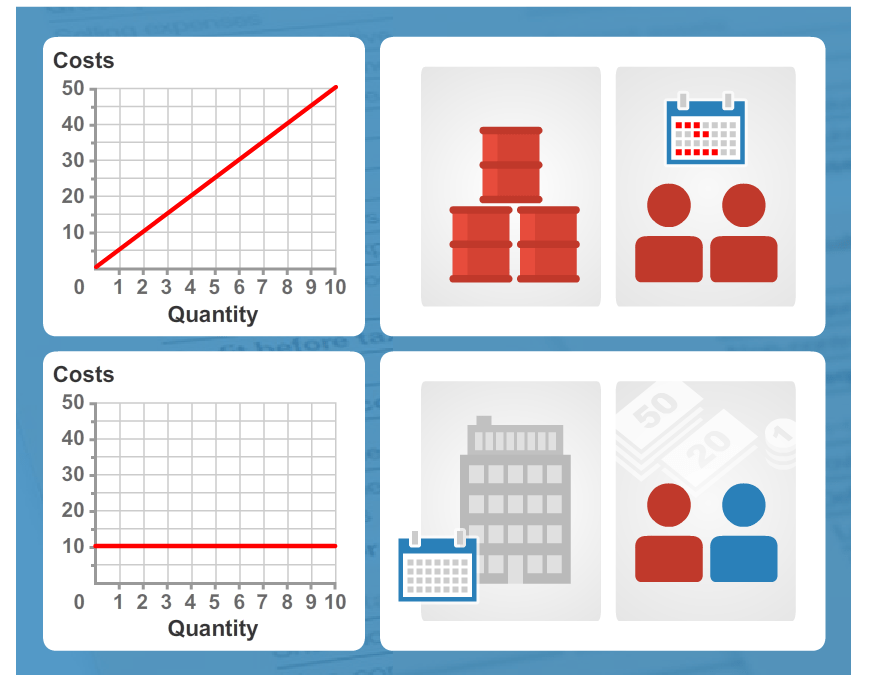
Unlike some materials costs, labour costs represent an immediate cash flow out of a company. Most businesses account differently for direct labour costs (e.g. people directly involved in producing a product) and indirect labour costs.


Profit and Loss Account DepreciationDepreciation is an accounting method used to spread the cost of capital assets in use for the long-term over the expected length of their ‘useful lifetime’. A depreciation expense is thus charged to the P&L for every year of that ‘asset lifetime’. So if machine costs 100 and is expected to last for 10 years, an annual depreciation charge of 10 (for example) could be charged for every year.

Profit and Loss Account Different costsThere are different ways of classifying the remaining costs that must be accounted for on a P&L. Most companies divide these according to business function e.g. admin, R&D, manufacturing, sales or advertising.


Including a cost in the P&L is based on whether it has been consumed during the period in question – irrespective of any cash flows out of the company. But this works the other way too: so if something has been paid for in advance, it will not be accounted for on the P&L until the financial period during which it is used.

Sometimes a business will use things that it hasn’t yet been charged for. In such situations (e.g. water used but not yet billed for) the company must make an estimate of the cost, and include that on the P&L.

Some potential (but likely) costs may need to be accounted for on the P&L in the form of provisions: but for these costs, the full details are not yet clear. For example, an on-going court case may result in a future financial liability (e.g. a fine). Here, the exercise of judgement is crucial on a ‘prudent’ basis (e.g. the business should recognise such issues as soon as they become likely).

A business will spend money on some costs (e.g. training) which can properly be counted as ‘intangible investments’ that will benefit it in the future. However, prudence dictates that their costs should still be recognised in the period in which they are incurred.

Profit and Loss Account - Fixed and Variable Costs

Variable costs are those costs and expenses which change in direct proportion to the level of output (or other business activities). Examples of variable costs include: Temporary labour and materials required to manufacture products; Buying goods for resale; Some selling and admin costs.

Fixed costs are those costs and expenses that usually stay at the same level whatever the level of business activity is (at least over the short term). Examples of these types of costs include office rent and regular salaries.

Breaking down costs into fixed and variable elements allows businesses to identify the marginal costs involved with making extra goods and products more clearly. This is known as ‘variable costing’.

About Brightbolts…

Brightbolts supports business by raising the financial literacy and business acumen of managers.

Brightbolts are specialists in helping managers and organisations raise their levels of financial literacy and commercial awareness. Our suite of customisable Finance for Non-Financial Managers eLearning courses are used by leading global organisations to equip their managers with the skills, understanding and acumen needed to be financially fit and ready for the challenges of running successful businesses.

Or contact us, to see how we can help you and your organisation…

[share title=”Share this Post” facebook=”true” twitter=”true” google_plus=”true” linkedin=”true” style=”color:#000″]

Finance for Non-Financial Managers: An Introduction to the Financial Statements

financial statements

A short guide to the Financial Statements for Non-Financial Managers…

The separation of ownership and control for modern businesses means that managers need to make detailed reports to the owners – in the form of Financial Statements.
Income StatementThe question of how well (or badly) a business is doing is answered in the form of the Profit and Loss Account (P&L). The P&L compares a business’ costs and expenses to its sales and works out the difference (e.g. the profits). Also known as the Income Statement, this is a key measure of success (or failure).

BalanceSheetWhat have managers bought during the period in question? And what obligations have they incurred (aside from the investment funds provided by the owners)? The Balance Sheet provides the answers to these questions. It records: Assets that have been bought; Liabilities that have been incurred; The level of shareholders’ investment funds that have been provided to the business.

cash flow

The Cash Flow Statement is used to record the impact of managers on the changes in a business’ cash holdings over the accounting period, in terms of receipts and payments. The Cash Flow Statement details this by analysing changes in key items on the Balance Sheet, and the extent to which cash flow has been generated from profits.

accounting standardsFinancial accountants’ are guided in their efforts to provide consistent financial information to the owners of a business by what are called ‘accounting standards’. These standards vary in different countries. Auditors (another kind of accountant) then check the resulting Financial Statements against these same standards.

Management accountants work with the same data that is used by financial accountants – but their reports are used for internal purposes. ‘Management accounting’ produces very detailed information that the managers of the business use to help them make future decisions (e.g. investment choices) – and thus contributes to the overall results of the business over time.

Four Accounts
Every transaction a business makes is classified according to its nature, and recorded via the creation of two corresponding entries in one or two of these four types of account: Income; Expenses; Assets; Liabilities.

The Income Accounts of a business are used to record all of the income that it has earned, from a variety of sources. These include: Interest payments received (or due); Sales of services or products.

A business’ Expense Accounts record costs of all types, such as: General expenses required to run a business and sell its products and services; Specific costs of making, buying or preparing products and/or services that are then sold; Interest that has been charged on any funds it has borrowed.

The Asset Accounts of a company record all of the assets that are either currently owned by that business, or which are owed to it. There are two key types of asset – Fixed Assets and Current Assets.

The Liability Accounts of a business will record two things: Any ‘monies’ for which the company is liable (based on past transactions); Where the funds have come from that are being used in the business.

LiabilitiesLiability accounts break down into three main types: Equity (e.g. the funds provided by the owners of the business); Loans (e.g. all of the funds that the business has borrowed in the past); Creditors (e.g. the money that the company owes for the things that it has bought).


About Brightbolts…

Brightbolts supports business by raising the financial literacy and business acumen of managers.

Brightbolts are specialists in helping managers and organisations raise their levels of financial literacy and commercial awareness. Our suite of customisable Finance for Non-Financial Managers eLearning courses are used by leading global organisations to equip their managers with the skills, understanding and acumen needed to be financially fit and ready for the challenges of running successful businesses.

Or contact us, to see how we can help you and your organisation…

[share title=”Share this Post” facebook=”true” twitter=”true” google_plus=”true” linkedin=”true” style=”color:#000″]

Do serious business people play games?

Gamification

The profile of gamification is growing within the eLearning industry, with dedicated conferences, books and detailed research being published by experts. More and more organisations are also starting to experiment with gamification techniques. However, there are issues with effectiveness, clearly demonstrated by the quote from Gartner who say that 80% of current gamified applications fail to meet the set business objectives, primarily due to bad design.

So what exactly is gamification?

There is no single definition for gamification. However, in the context of eLearning, it essentially is the use of gaming elements and game design to increase the effectiveness of the learning. Adding value to the experience through the use of gaming elements such as:

  • Point scoring and badges
  • Leader boards
  • Competitive elements and challenges
  • Levels and progression
  • Rewards and punishment
  • Avatars

Is the concept driven by demand or is it a concept that the industry is prescribing?

The jury is out on this one. The first academic papers and research came about in the 1980s and since then many organisations have come and gone who focused on the serious application of games.

An interesting clue as how to perhaps answer the above question can be taken from the below statistics.

  • The gaming industry is currently worth $57 billion
  • The average gaming consumer is 30 years old
  • The gender divide is 55% male 45% female

Providing it is done well, gamification should then have the potential to be a powerful and popular technique. Making the mundane a little more fun and providing a safe environment to make creative and innovative solutions to modern business problems.

Successful gamification

The keys to success with gamification are:

  • Don’t use it for the sake of using it
  • Set a clear objective that the game is to achieve
  • The game needs to effectively transfer learning
  • It needs to be right for the audience and demographic you are trying to teach
  • The game needs to motivate the learner and add extra interest
  • It’s purpose should be meaningful
  • The game should provide a platform to make autonomous decisions
  • It should provide a pathway to allow the individual to improve
  • It should be designed well
  • The relevant stakeholders should be involved at every step of the process

At Brightbolts we specialise in creative and effective eLearning solutions. Whether it be a simple TakeAway learning infographic, a Snippet of mobile learning or a full-on Chunk of eLearning, we will provide the solution that best meets your needs.

Please contact us for a chat about your requirement and to find out how we can best help…

[share title=”Share this Post” facebook=”true” twitter=”true” google_plus=”true” linkedin=”true” style=”color:#000″]

We are ELEARNING SUPERSTARS…

A module from our Finance for Non-Financial Managers elearning courses has been picked up and positively reviewed by Elearning Superstars.

Read more here…

[share title=”Share this Post” facebook=”true” twitter=”true” google_plus=”true” linkedin=”true” style=”color:#000″]

A visual history of human knowledge

In this fascinating TED presentation, infographics expert Manuel Lima explores the thousand-year history of visualising information and explains the increasing shift away from using knowledge trees to networks of information.

At Brightbolts, we love an infographic. Our beautiful, clear and simple TakeAway learning infographics are designed for the immediate consumption and digestion of your complex information:

  • Present complex information quickly and clearly
  • Improve cognition by tapping into the human visual system
  • Designed to be viewed on all devices
  • Can be scaled to any size for printing as posters
  • Can be static, animated and interactive

Download an example of one of our TakeAway Infographics here and contact us to see how we can help you visualise your information either as part of an eLearning programme or as a stand-alone solution.

[share title=”Share this Post” facebook=”true” twitter=”true” google_plus=”true” linkedin=”true” style=”color:#000″]

Why do so many small businesses fail in their first year?

There is no doubt that the environment for business is tough, with 50% of small business expected to fail within 5 years. Many of the adverse factors affecting business, such as tax and bank lending are out of the operational control of business owners and managers.  So in order to survive, small business needs to make the most of their resources and ensure that they have the knowledge and skills to survive.

Also listed among the common reasons for the failure of small business are:

  • A lack of business acumen,
  • Poor financial planning,
  • Bad cash flow management.

To survive, business owners and managers of small enterprises must be able to rise above the minutia of day-today business decisions and see the bigger picture.

They must understand how the cogs of business fit together to impact profitability and cash flow, and they must be able to assess the impact of their potential decisions on the success of the business.

To truly understand the business, owners and managers have to understand how their business makes money – in other words, how it generates sales, maximises profit and manages cash. They need to understand that every action taken and every decision in each area of their business will impact these ultimate measures of business success.

Business owners and managers of small enterprises are typically forced to develop this business acumen on their own. They are hands-on with their businesses, having to make all the decisions as they go along, whether good or bad. As the statistics show, they either learn from their mistakes or fail.

Common problems for SMEs

Small and Medium Enterprises (SMEs) are often confronted with problems that are uncommon to the larger companies and multi-national corporations.  These problems include the following:

  • Lack of Credit: SMEs frequently have difficulties in obtaining capital or credit, particularly in the early start-up phase.
  • Profit vs Cash: Understanding the difference between profit and cash.
  • Cash Flow Management: Protecting and enhancing their cash flow position.
  • Financial Statements: Understanding financial statements and their use in making better business decisions.
  • Survival, stabilisation and planning for the future.
  • Working capital, investments, financing business assets or assistance with international trade.
  • Restricted Resources:Their restricted resources may also reduce access to new technologies or innovation.
  • Resistance to Change: Many of the employees in SMEs started from the ground up after working with the company for many years.  Some of them are often holding supervisory and managerial positions. These employees may not be IT literate and often have high resistance to the changes in the working process that they are comfortable with after many years.
  • Lack of Procedure: Most SMEs do not have formal procedure or often these are not documented.  Furthermore, there is tendency for these procedures to change frequently.  This makes it difficult for third parties and newcomers to understand the existing business practices.
  • Lack of Managerial Training and Experience: Managers who are promoted from the rank and file may not have had the exposure or training needed to perform as leaders and managers of people.
  • Manpower: SMEs are frequently fire fighting and suffer from shortage of manpower.

Brightbolts supports business by raising the financial literacy and business acumen of managers.

Brightbolts are specialists in helping managers and organisations raise their levels of financial literacy and commercial awareness. Our suite of customisable Finance for Non-Financial Managers eLearning courses are used by leading global organisations to equip their managers with the skills, understanding and acumen needed to be financially fit and ready for the challenges of running successful businesses.

Or contact us, to see how we can help you and your organisation…

[share title=”Share this Post” facebook=”true” twitter=”true” google_plus=”true” linkedin=”true” style=”color:#000″]

How financially fit are your managers?

Most people in management, start their careers as specialists and high-achievers from within the business. Their potential is obvious, so they are promoted through the ranks. But, being an amazing and innovative engineer or a big-hitting sales person does not mean that you will naturally be a great leader.

Many career paths just do not provide the necessary exposure to managing people, budgets and to understanding the nuts and bolts of business that are essential to becoming a successful manager.

From the outset, managers are expected to be decision makers and leaders, this is a heavy burden to carry when you do not have the necessary commercial awareness to understand the full implications of the decisions that you are making.

Becoming financially literate and commercially aware should be one of the first development needs addressed by all managers.

Managers need to understand how a business makes its money, manages its cash, maximises its profits and how each person, role and function can positively influence business performance.

Managers need to own a fundamental foundation of financial literacy, or an understanding of the financial statements and an operational understanding of how they can best use this financial information to make decisions that positively impact on the success of the business.

Being commercially aware is the difference between being able to read and understand financial statements and being able to read, understand and interpret this information to make informed business decisions.

When commercial awareness is embedded in an organisation, its managers begin to ask more informed questions.

Questions that take into account the impact of potential decisions on different parts of the business and also how the outcome of their decisions will finally impact upon the company’s financial performance and results.

  • Has the cost of production gone up? If so, why?
  • Have we changed our pricing model? If so, how has that affected our margins?
  • If our production unit costs have gone up, can we better control our production processes or service delivery?
  • Is there a way to produce a greater product volume at the same cost?
  • Can we raise prices, yet still provide value to the customer and remain competitive?
  • Are we creating value for our shareholders?

When questions become more informed, the right decisions can be made.

Brightbolts are specialists in helping managers and organisations raise their levels of financial literacy and commercial awareness. Our suite of customisable Finance for Non-Financial Managers eLearning courses are used by leading global organisations to equip their managers with the skills, understanding and acumen needed to be financially fit and ready for the challenges of running successful businesses.

Or contact us, to see how we can help you and your organisation….

[share title=”Share this Post” facebook=”true” twitter=”true” google_plus=”true” linkedin=”true” style=”color:#000″]

Trends and forecast in eLearning

The LMS provider Docebo commissioned a fantastic report on the health of the elearning industry. It is a document that I have referred to a great deal in recent months, so thought I would share the facts and figures that I found most useful/interesting. All content is taken directly from the Docebo report. A link to the full document can be found at the end of this post.

Trends and forecast in eLearning

There seems to be universal agreement that the worldwide E-Learning market will show fast and significant growth over the next three years. The worldwide market for Self-Paced E-Learning reached $35.6 billion in 2011. The five-year compound annual growth rate is estimated at around 7.6% so revenues should reach some $51.5 billion by 2016. While the aggregate growth rate is 7.6%, several world regions appear to have significantly higher growth rates. According to recent regional studies, the highest growth rate is in Asia at 17.3%, followed by Eastern Europe, Africa, and Latin America at 16.9%, 15.2%, and 14.6%, respectively.

Each of the world’s regions has its idiosyncrasies In terms of the factors that drive this market. The U.S. and Western Europe markets are the most mature. The U.S.A. spent more on Self-Paced E-Learning than anywhere else in the world.

Western Europe is the world’s second largest buying region for E-Learning products and services but Asia is predicted to outspend Western Europe in E-Learning terms by 2016.

In 2012, Bersin & Associates stated that there were some 500 providers in the LMS market and only five of them have more than a 4% market share. According to this, the LMS market was expected to reach $1.9 billion in 2013. However the growth exceeded expectations, closing the year at $2.55 billion.

E-Learning is subjected to the influences of sales trends related to smart connected devices and the Internet megatrend (that is, the spread of the Internet in the world).

According to IDC, the number of PCs will fall from 28.7% of the device market in 2013 to 13% in 2017. Tablets will increase from 11.8% in 2013 to 16.5% by 2017, and smartphones will increase from 59.5% to 70.5%.

The new frontier to address is the trend towards Bring Your Own Device (BYOD) — where individuals take their personal (usually mobile) devices to workplaces. Increasingly, these seem to be being used to help their owners perform work activities (including formal training), both in and out of the workplace. Smartphones are the most common examples of these devices but employees often also use their tablets or laptops in the workplace.

While the corporate-training market has lagged behind other education-based sectors, it continues to represent a viable investment opportunity. The corporate-training market is among the most cyclical within the education industry. Since 2010, employers’ total spending on training and the amount spent per employee — the key data used to measure this sector — have been

declining. However, the corporate market related to outsourced services (net of all ancillary costs) has grown to reach 42% of total expenditure.

Within the training industry, the E-Learning sector has grown consistently in recent years. All its subsectors (Packaged Content, Platform, and Authoring tools) show positive annual

growth. Market acceptance of E-Learning has resulted in its increased use for both large and small companies. SaaS/ Cloud E-Learning solutions are particularly suitable for Organizations ranging from SMEs to large institutions.

General budget constraints appear to be the main drivers of the shift towards using E-Learning. However, E-Learning is not merely a solution which is attractive during an economic downturn but it is also an efficient and cost-effective solution when workers — especially those in Organizations with a widely geographically distributed workforce — need to be brought up-to-speed quickly on relevant knowledge and skills.

With the inflow of an estimated $6 billion of venture capital over the past five years, E-Learning is being driven not only by startup dot-com entrepreneurs but also by big corporations, for-profit spin-off ventures, as well as big and small universities.

According to Product & Users, the LMS market is expected to experience a growth of 23.17% between 2017 and 2018. According to Ambient Insight, the packaged content market will reach $38.3 billion by 2016 (SOURCE: AMBIENT INSIGHT 2012).

According to sources, large and affirmed Companies (such as the Global 5000) are the primary buyers of E-Learning products and services. They account for more than 30% of the E-Learning Market clientele.

Total E-Learning Market

(LMS + Packaged Content + Other Services)

2013 2016
Total 40.605 51.172
North America 23.800 27.100
Western Europe 6.800 8.100
Eastern Europe 729 1.200
Asia 7.100 11.500
Middle East 443 560
Africa 333 512
Latin America 1.400 2.200

Packaged Content

2013 2016
Total 30.153 38.000
North America 17.674 20.124
Western Europe 5.050 6.015
Eastern Europe 541 891
Asia 5.272 8.540
Middle East 329 416
Africa 247 380
Latin America 1.040 1.634

LMS Market

(covering all the technical solutions available)

2013 2016
Total 2.550 3.214
North America 1.495 1.702
Western Europe 427 509
Eastern Europe 46 75
Asia 446 722
Middle East 28 35
Africa 21 32
Latin America 88 138

Other services related to E-Learning activities

2013 2016
Total 7.902 9.958
North America 4.632 5.274
Western Europe 1.323 1.576
Eastern Europe 142 234
Asia 1.382 2.238
Middle East 86 109
Africa 65 100
Latin America 272 428

AFRICA

The people of Africa seem willing to engage with new technologically-based tools to improve their education, knowledge and skills. However, the continent’s infrastructure is proving to be a major challenge and an obstacle to meeting this growing level of demand.

2013 Revenues $332.9M
Annual growth rate 15.2%
Revenues by 2016 $512.7M

EASTERN EUROPE

2013 Revenues $728.8M
Annual growth rate 16.9%
Revenues by 2016 $1.2B

ASIA

Asia has the world’s highest regional growth rate for E-Learning, of 17.3%.

Revenues from the sale of E-Learning reached $5.2 billion in 2011 and are expected to more than double to $11.5 billion by 2016. The vast majority of these revenues will be generated from the sales of packaged content.

2013 Revenues $7.1B
Annual growth rate 17.3%
Revenues by 2016 $11.5B

NORTH AMERICA

North America is the most mature market for E-Learning in the world. In 2011, the U.S.A. spent more on Self-Paced E-Learning than anywhere else in the world.

While the rate of growth in this market may seem low compared with other world regions (at a mere 4.4%), the revenues generated in this market are extremely high.

2013 Revenues $23.8B
Annual growth rate 4.4%
Revenues by 2016 $27.1B

WESTERN EUROPE

Western Europe is the world’s second largest buying region for E-Learning products and services after North America.

This is set to change in the upcoming forecasted period. Asia is predicted to outspend Western Europe in E-Learning terms by 2016.

“Despite being a mature market, 2013 was nevertheless a transitional year for E-Learning in Western Europe. We can put aside the buzz about MOOCs in higher education and all the noise about a coming shift to mobile.

“For those of us who focus on workplace learning, the interesting shift is the number of small and medium sized businesses that have started to adopt sophisticated learning technologies. With the pricing structure of products such as Docebo, suddenly smaller companies are realizing that there is a very low barrier to entry for them to have enterprise grade capability in this area.

“The other trend we’ve observed, from the larger corporations in our client base, is a shift to outsourcing the development of E-Learning content to professional agencies rather than building in-house. We’re excited about the landscape for 2014.”

Guy McEvoy, Managing Director, Guykat

2013 Revenues $6.8B
Annual growth rate 5.8%
Revenues by 2016 $8.1B

LATIN AMERICA

2013 Revenues $1.4B
Annual growth rate 14.6%
Revenues by 2016 $2.2B

MIDDLE EAST

The Middle Eastern E-Learning market is growing rapidly due to market makers, such as Governments, Private Schools and Corporations. This infographic relates to 2013 E-Learning revenues, the market annual growth rate and the forecasts for revenues in 2016.

Oman is the top performer in E-Learning terms for the rankings that cover the Middle East. Oman has the highest growth rate in the region at 19.6%, followed by Lebanon (16.0%), Turkey (12.9%), Kuwait (12.6%) and Qatar (11.3%).

This is mainly because the Government of Oman is interested in issues relating to education and computer literacy and, consequently, is investing heavily in the sector.

For example, Sultan Qaboos University (SQU) regularly provides professional development workshops for its staff.

This acquaints them with E-Learning technology from an educator’s perspective. To date, over 200 staff have attended such workshops. In addition, almost as many regular courses have some E-Learning content included.

“Middle Eastern Governments are strongly committed to promoting a Mass Digitalization process. This means that heavy investments are being made in this initiative. This is especially true for Soft Skills training. This is designed to quickly and competitively improve the workforce. Is compliance training in this region the next “big thing”? Time will tell, but lots of regulations are already coming…”

Claudio Erba, CEO & Founder, Docebo

2013 Revenues $443m
Annual growth rate 8.2%
Revenues by 2016 $560.7M

All content is copyright © 2014 Docebo – All rights reserved.

The full report can be downloaded from the Docebo website at:

https://www.docebo.com/landing/contactform/elearning-market-trends-and-forecast-2014-2016-docebo-report.pdf

[share title=”Share this Post” facebook=”true” twitter=”true” google_plus=”true” linkedin=”true” style=”color:#000″]

Musings on MOOCs

MOOCs burst onto the scene in 2012 with lots of hype and press attention. There was talk about the democratisation of education and disruption to the corporate training market, but what is the reality now that we are 3 years in?

MOOC stands for Massive Open Online Courses. The concept was born out of US academia, with the idea that a university could freely make available it’s teaching programmes online through the use of video, assessment and forums, opening up the programmes to an unlimited number of people. The first MOOC was a huge success in this regard, enrolling some 100,000 people.

Essentially, a MOOC is an LMS that provides free access to blended programmes of online content (video, assessments & forums).

There are now successful ‘for-profit’ MOOCs, such as Udacity & Coursera and ‘non-profit’ MOOCs such as edX that provides access to university content, but all the hype seems to have fallen flat.
Universities are now getting onboard, but generally in the capacity of using MOOCs as a promotional taster to drive enrolment to their fee-paying residential programmes.

Some institutions have also adopted the ‘Freemium’ approach, where the course is free – but you pay for certification.

Neither the ‘for profit’ or ‘non-profit’ MOOCS have had the predicted major impact on education or corporate training (yet).

From the outset, completion rates have been a big problem. Out of the 100,000 people who enrolled on the first MOOC only 1,000 saw it through to completion. There is much discussion in regards the reasons for this, the following 2 points most regularly surface:

  1. The learning experience is not engaging.
  2. It’s free, so people are less committed.

Both points are valid.

Effective elearning is well designed to be interactive, to engage, immerse, test and entertain. Lots of skill, thought, expertise and money is put into the development of good online courses. Video can be a fantastic resource for the transfer of knowledge, but not if it is simply a video of lecturer talking – especially if the video is too long. Online assessment, peer assessment and conversation on forums serve a purpose, but fall way short of the experience of engaging and facilitated classroom discussion.

If you pay for something, you are investing in it, so levels of commitment will naturally be higher. However, MOOCs are supposed to be ‘Open’. ‘Open’ = FREE.

Education as the antedote for poverty is a hugely romantic and captivating idea. Sadly, the reality is that 85% of those people who use MOOCs already have a degree and tend to be drawn from the already privileged in society. Knowledge is already free, the internet if full of amazing free resources, so perhaps the curation of this free content could have just as much impact?

The impact on corporate training has yet to be felt. Corporate training programmes don’t tend to be ‘Massive’ or ‘Open’, so I do not foresee any huge impact. Online programmes from a prestigious university would of course be attractive to a large corporate. However, recent years have seen a big shift in bespoke and customised content – so the one-size fits all approach may not be that attractive.

My prediction for the future is that the leading universities and business schools will succeed in creating an online presence. They have the money to invest, so can develop high quality content and sell it on the back of their brands. Offering certification and badges without watering down the value of their traditional programmes. They have no choice but to shift their teaching practices to meet the technological expectations of Generation C.

The question to then ask is – is this not just elearning?

Parallels between MOOCs and the eLearning industry of 15 years ago can be drawn. eLearning had a tough time due to the practice of selling vast libraries of poorly made off-the-shelf content. Completion rates were poor, because of quality, relevance and also due to lack of internal promotion by the companies who bought it. Thankfully lessons have been learnt and elearning is now accepted as an effective method of training. The universities seem to me to be following the same route.
[share title=”Share this Post” facebook=”true” twitter=”true” google_plus=”true” linkedin=”true” style=”color:#000″]